In today’s business landscape where competition is getting harsher, data has proven to be a game-changer in learning customer behavior and driving smart decision making for product innovation and process optimization.
McKinsey’s research reveals organizations that leverage data are 23 times more likely to acquire customers, 6 times more likely to retain them, and 19 times more likely to be profitable.
What’s hard for businesses is how to extract actionable insights from mountains of data generated daily. And that’s when data analytics play a role. Let’s explore with us what data analytics is, its types, process and many more
What is data analytics?
Data analytics is a systematic approach to examining, cleaning, transforming, and modeling data to uncover valuable insights, inform conclusions, and guide decision-making. This multifaceted process involves applying various techniques to interpret data from diverse sources, including both structured and unstructured formats.
For example, a financial institution can leverage data analytics to assess customer spending habits, creditworthiness, and risk profiles. By understanding these patterns, the institution can tailor financial products to individual customer needs, optimize investment portfolios, and manage risks effectively, ultimately enhancing profitability and customer satisfaction.
What are the types of data analytics?
Descriptive analytics
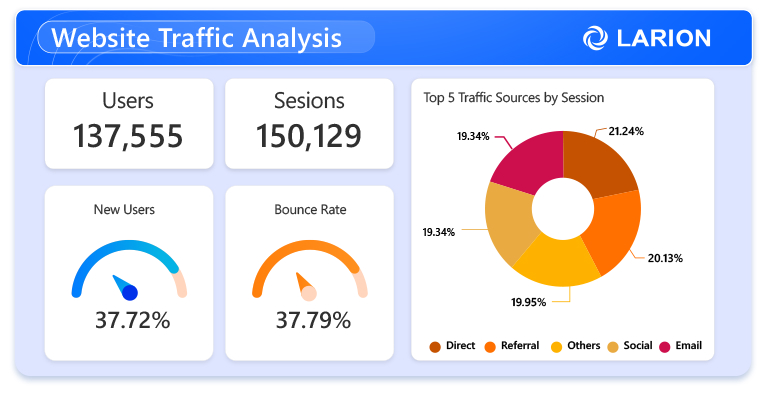
Descriptive analytics delves into past data to answer the question, “What happened?” It provides a summary of historical information to understand past performance. Companies employ statistical analysis techniques to conduct descriptive data analysis, allowing them to compare previous outcomes and identify irregularities.
Techniques such as data aggregation and data mining are instrumental in this process. Examples include sales reports, website traffic analysis, and customer demographics.
Diagnostic analytics
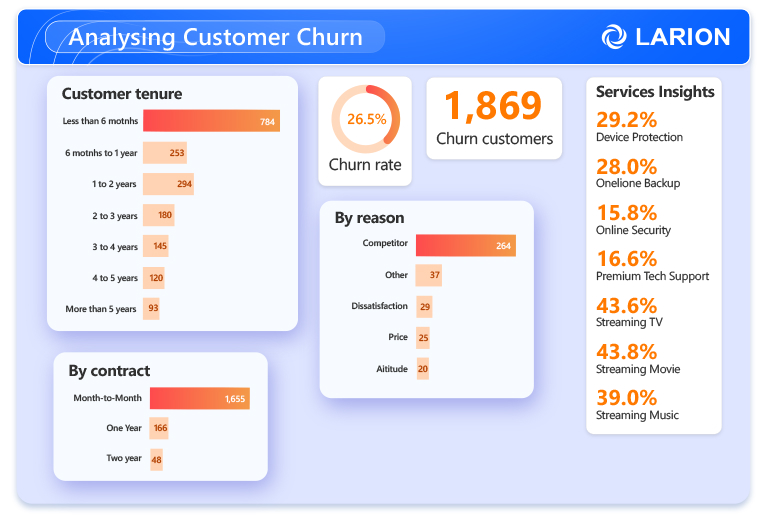
Diagnostic data analytics focuses on understanding the underlying causes of anomalies by examining past data. It aims to answer the question, “Why did this happen?” building on insights from descriptive analytics. The results of diagnostic analytics enable companies to develop effective solutions according to the investigated root causes.
Key techniques in diagnostic data analytics include drill-down, data discovery, data mining, and correlation analysis. Data discovery helps analysts locate relevant data sources that may provide insights into the causes of observed results. Data mining extracts valuable information from large datasets through automated processes. By identifying correlations or patterns between different data sets, analysts can derive meaningful insights.
Examples include analyzing customer churn or identifying patterns in website errors.
Predictive analytics
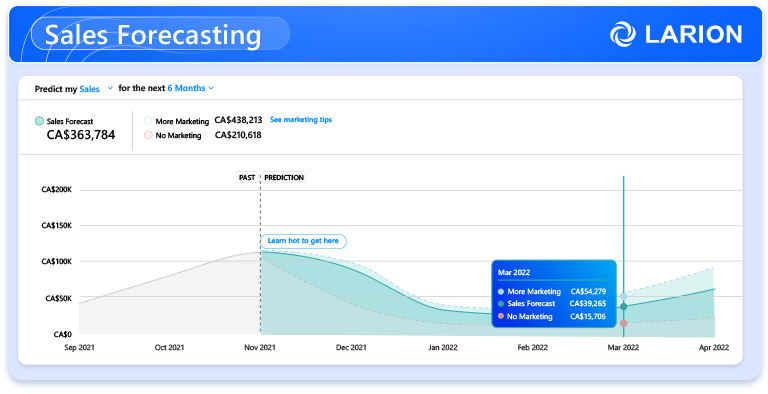
Predictive data analytics uses current and historical data to forecast future trends and outcomes, addressing the question, “What will happen?”. By combining historical data with machine learning, data mining techniques, and statistical modeling, individuals and companies can identify patterns and anticipate potential risks and opportunities.
This type of analytics relies on algorithms and methodologies, such as linear or logistic regression models, to generate predictions. Examples include fraud detection, maintenance scheduling, sales and demanding forecasts.
Prescriptive analytics
Prescriptive data analytics provides optimal recommendations based on predictive models and business objectives, addressing the question, “What should we do?”. It builds on insights from predictive and descriptive analytics to offer guidance on achieving specific goals.
This type of analytics is used in diverse areas such as recommendation engines, loan approval systems, dynamic pricing strategies, and machine repair scheduling. By evaluating various decision options, prescriptive analytics personalizes and refines processes.
Techniques like optimization, simulation, and machine learning are employed to deliver these insights. Examples of its application include inventory management, pricing optimization, and supply chain optimization.
6 phases of data analytics process
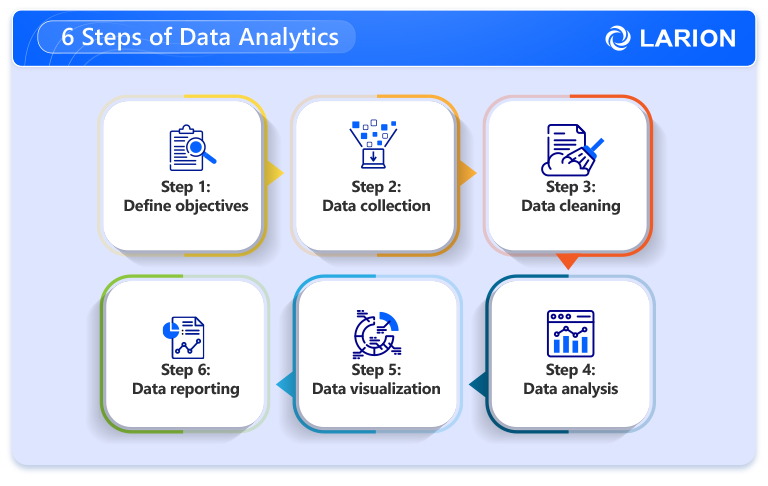
Step 1: Define goals & questions
The initial step is to articulate problems or questions you want to answer. This step is vital as it guides the entire process. It requires understanding the objective or situation, identifying the necessary data to tackle it, and defining the metrics or indicators to measure the results.
Step 2: Data collection
After defining the objectives and questions, the next step is to collect the relevant data. This can be achieved through various methods such as surveys, interviews, observations, or by extracting information from internal databases. The collected data can be categorized as quantitative (numerical) or qualitative (non-numerical), depending on the specific problem and questions being addressed. It is crucial to ensure the data collected is accurate, complete, and consistent. Additionally, strict adherence to data privacy and security regulations is paramount to protect sensitive information.
Step 3: Data cleaning
Data cleaning involves identifying and handling missing values, outliers, inconsistencies, and errors in the data, and transforming it into a suitable format for analysis.
Step 4: Data analysis
With the data cleaned and prepared, the next step is to apply statistical methods and machine learning algorithms to discover patterns, relationships, and trends. From extracted insights, you can test hypotheses and draw meaningful conclusions
Step 5: Data visualization
Once the data is analyzed and interpreted, the following step is to present them in an easily understandable format. This involves selecting appropriate charts, graphs, or other visual elements to simplify complex information and clearly convey key findings.
Step 6: Data reporting
The final stage involves communicating findings in a clear and concise manner, highlighting key trends and patterns. Based on these insights, actionable recommendations are formulated to address specific challenges or capitalize on opportunities. Ultimately, the results are presented to stakeholders in a digestible format, such as reports, dashboards, or presentations, ensuring that the value of the analysis is effectively communicated.
How does data analytics help businesses?
Here are some key data analytics benefits:
- Improved decision making: By uncovering trends, patterns, and correlations, you can facilitate strategic decision making, identify potential challenges/opportunities and optimize resource allocation
- Enhanced operational efficiency: Data-driven insights reveals bottlenecks and inefficiencies, helping you streamline operations and eliminate unnecessary expenses.
- Improved customer satisfaction: In-depth customer insights provide a better understanding of customer behavior and needs. This enables you to tailor products and services to individual preferences, establish more targeted marketing, predict customer churn, and implement effective retention strategies.
- Gain competitive advantages: Effective data analytics empower you to forecast trends, detect new market opportunities, guiding the development of new products or services, and increasing your chance of success
- Risk management: Data analytics enables the identification of fraudulent patterns, protect assets, forecasts potential risks, and establish effective mitigation strategies
Popular data analytics tools
Data analysis offers a wide range of tools tailored to different needs, complexities, and skill levels. From programming languages like Python and R to visualization platforms such as Power BI and Tableau, these tools serve various functions.
Choosing the right data analytics tool depends on several factors.
- Size and complexity of data: Consider the tool’s capacity and scalability to handle your data volume and complexity.
- Type of analysis: Choose a tool based on whether you need – basic reporting, advanced analytics, or specific data manipulation features.
- Team’s skill set: Evaluate the tool’s ease of use relative to your team’s technical expertise, whether they are skilled in coding or prefer user-friendly interfaces.
- Budget constraints: Factor in the cost of the tool, ranging from free and open-source options to premium, enterprise solutions.
Here’s an overview of some prominent tools in these areas:
Data visualization and business intelligence
- Tableau: Known for its intuitive interface and powerful visualizations.
- Power BI: Microsoft’s comprehensive business intelligence tool with strong integration with other Microsoft products.
- Qlik: Offers associative data discovery, allowing users to explore data freely.
- Looker: Cloud-based platform with a focus on data exploration and embedded analytics
Data analysis and manipulation
- Python (with libraries like Pandas, NumPy, SciPy): A versatile language for data manipulation, analysis, and machine learning.
- R: Statistical computing and graphics language widely used for data analysis and modeling.
- Excel: A familiar tool for basic data analysis, pivot tables, and visualizations.
- SQL: Essential for data querying and manipulation in databases
Machine learning and advanced analytics
- Python (with libraries like TensorFlow, PyTorch, Scikit-learn): Leading platform for machine learning and deep learning.
- SAS: Comprehensive analytics suite with advanced statistical procedures.
- SPSS: Statistical software for data analysis and modeling.
Data integration
- Talend: Open-source data integration platform.
- Informatica: Enterprise-grade data integration and management tool.
- dbt: Data transformation tool for building and managing data pipelines.
Data analytics vs data science vs business intelligence
Although those terms are often used interchangeably, they represent distinct roles with different levels of complexity and focus.
| Data Analytics | Data Science | Business Intelligence | |
| Focus |
Examines and interprets historical data to identify patterns, trends, and insights |
Building predictive models and algorithms to uncover insights from structure and unstructured data |
Providing actionable insights to support strategic business decisions through visualization and reporting |
| Tools |
Excel, Tableau, Power BI, and SQL |
Python, R, Jupyter Notebooks, TensorFlow, and Scikit-learn |
Power BI, Tableau, QlikView, SAP BusinessObjects |
| Key Techniques |
Statistical analysis, data mining, data visualization |
Machine learning, predictive modeling, deep learning, natural language processing |
Dashboarding, reporting, data warehousing, ETL processes |
| Use Cases |
– Customer segmentation – Sentiment analysis – Churn prediction |
– Predictive maintenance – Fraud detection – Recommendation engine |
– Sale performance monitoring – Financial reporting – Risk management |
Future trends of data analytics
AI-driven analytics
Drive smart decisions today with data analytics!
In today’s digital age, where operations and customer interactions are predominantly online, data analytics has become an essential agenda for enterprises across all fields and industries. The ability to interpret data, extract actionable insights, and use those insights to make informed decisions provides a significant competitive edge.
As we delve into the fundamentals of data analytics—understanding its definition, types, processes, benefits, and tools—you gain a comprehensive overview of what the process entails. However, seamlessly integrating data analytics into your existing operations requires more than just knowledge; it demands expert guidance to minimize risks and maximize ROI.
With over two decades of experience, we’ve assisted enterprises of all sizes in designing and implementing data analytics strategies that align perfectly with their unique needs and goals. Our end-to-end services encompass goal-setting, data governance policy development, data infrastructure design, tool selection, and the formation of skilled data teams.
Want to see how data-driven insights can propel your business forward? Schedule a consultation with our team today and learn how our proven strategies can help your business thrive.